Understanding What Kepler Did--Part I
Kepler managed to discover the actual shape of the orbit of the planet Mars in its circulation around the Sun, as well as the rule governing its motion in the orbit. It was an astonishing accomplishment, and in this column and a few subsequent ones I hope to give some idea of what he did. ...
 Bill Casselman
University of British Columbia, Vancouver, Canada
Email Bill Casselman
Introduction
At the beginning of the 17th century, the German mathematician Johannes Kepler broke with all previous astronomical tradition in describing the motion of planets in the solar system. Previously, astronomers had only ventured to plot the apparent position of planets as seen from Earth, which meant that the actual physical position of a planet, and in particular its physical distance, played little role. It must be said that there were reasons for this tradition --- mostly because observations were scarce and, with the mechanical tools at hand, very inaccurate. But there had also been conceptual difficulties that were not eliminated until the heliocentric scheme advocated by Copernicus around 1540 had been adopted thoroughly.
The problem of inadequate observations was mostly solved by the vast collection of data assembled by the Danish astronomer Tycho Brahe. But Tycho had not agreed with Copernicus' point of view (no pun intended), and until Kepler arrived as his assistant his data on planetary motions did not contribute much to clarity. After Tycho's death, Kepler managed to discover the actual shape of the orbit of the planet Mars in its circulation around the Sun, as well as the rule governing its motion in the orbit. It was an astonishing accomplishment, and in this column and a few subsequent ones I hope to give some idea of what he did. Of course there have already been many attempts to do this, but with a topic like this, there should always be room for more.
I'll start by formulating the problem that I want to deal with, one that Kepler confronted at the beginning of his project:
Given data plotting the position of Mars as seen from Earth over a period of several years, how could he determine its orbit?
This is a purely mathematical problem, one in geometry, since we take the data as deduced from observation. Its difficulty is that from Earth one can only judge angles, nothing at all about distances measured in units familiar on Earth. Furthermore, as Kepler worked into things he discovered that the problem was quite a bit more complicated than he had originally thought. It turned out that in order to solve it he had first to determine more accurately than previously known the motion of the Earth around the Sun. It may well be that it was Copernicus who brought seriously into attention the idea of a solar system with all motion around the Sun, but it was Kepler, writing more than a half century after Copernicus, who first realized the consequences of this idea, and who first made Copernicus' rather vague idea into something practical.
I should amplify a bit what the ground rules are. I want to simulate Kepler's environment in a reasonable way. At the time he wrote his work on Mars, all astronomical observations were done by eye alone (although telescopes began to be used later in his lifetime). One practical effect of this for us is that we don't have to worry too much about accuracy. Another is that we are restricted to night-time observations of Mars and day-time observations of the Sun.
Assembling the data
Kepler had available to him a few things that none of his predecessors else did. (1) He had at hand the very accurate data of planetary motions compiled by the Danish astronomer Tycho Brahe, which amounted to many, many observations of the motion of all of the visible planets, with an abundance and an accuracy never seen before. The observations of Brahe were soon to be made obsolete by the use of the telescope, but his data were just accurate and abundant enough for Kepler to rule out previous theories and verify his own. (2) He had, for various reasons, an unshakeable faith in the heliocentric theory put forth rather weakly by Copernicus.
The tables of Brahe are still extant to some extent, and his collected works can be found on the internet (for example at archive.org) but I have not tried to use them. Instead I shall take data from the NASA HORIZONS project via its data request page. These data are in fact produced by computer computation. But they are constantly reevaluated and may be taken by us as empirical data. This project is a trove of buried treasure, but it does require some background in order to dig it up. This column will be largely devoted to explaining this background.
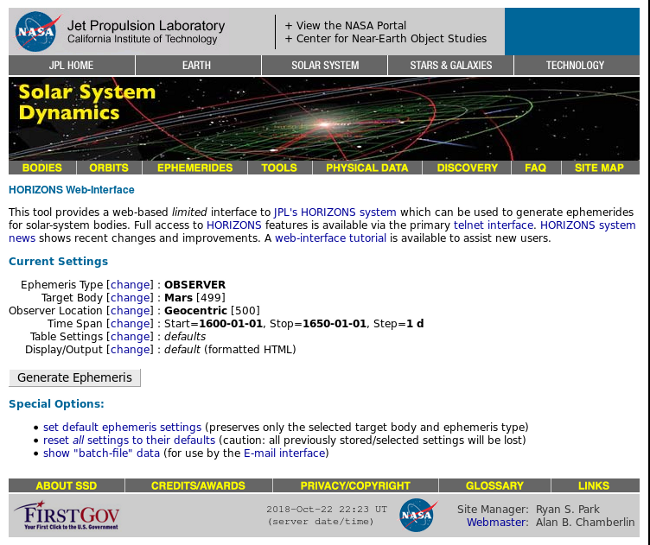
The relevant NASA page looks like this:
First you enter the parameters of the plot you want to make. Here I have chosen Mars for the years 1600-1650, as seen from Earth. More specifically, the center of the Earth, as if that were possible. Of course that is not a feasible place to observe from, but the effects of the Earth's rotation from an observer's location on the rotating surface would cause minor effects on observation that we do not want to deal with. A useful setting you might want to change is Display/Output --- one option is to send the data to a file you can name. When you have made all your choices, press the button Generate Ephemeris and, with default output, after a very short time you get a very long web page whose top looks like this:
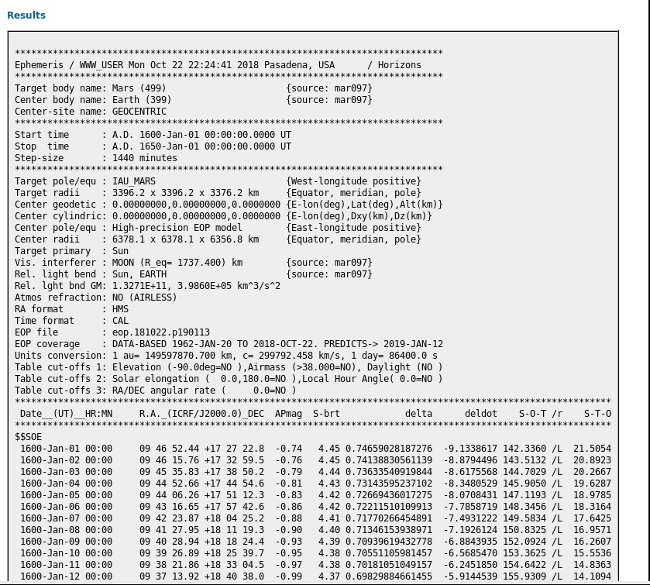
It looks complicated, but for our purposes very little of what you see is relevant. What we want are the coordinates of the planet being plotted. These will be expressed in the equatorial coordinate system, which I'll recall in a moment, and are contained in the table at the bottom. There are many, many lines in the table (more than 18,000!), since I have asked for 50 years of data, day by day. Each line specifies the position of the planet at a certain time, along with other data we won't use. It is possible to cut and paste to store the output conveniently.
Here, for example, is the first line in the screen shot:
1600-Jan-01 00:00 09 46 52.44 +17 27 22.8 -0.74 4.45 0.74659028187276 -9.1338617 142.3360 /L 21.5054
Individual items of data are separated by spaces. We care about only a few initial ones. The first two specify the date and the time of day in Universal Time. The next aix columns specify angles. The first three items 09 46 52.44 specify the Right Ascension (the analogue of longitude in this coordinate system) and the three after that --- i.e. +17 27 22.8 --- the Declination (the analogue of latitude). I'll say something about these in a moment. At the moment I just want to point out how to read these as angles, which might not be immediately apparent. Mathematicians measure angles in radians, which is in some sense an absolute measurement --- there are $2 \pi$ radians in a complete circle. In common usage, angles are measured in degrees --- there are $360$ degrees in a complete circle. But astronomers? Well, the Declination is recorded in degrees, but with a few mildly odd features. First of all, the Declination lies between $-90^{\circ}$ and $90^{\circ}$. Second, it is expressed in a mixture of base $60$ and $10$. Thus the +17 27 22.8 is to be read as $17^{\circ} \> 27\,' \> 22.8\,''$ (i. e. in degrees, minutes, and seconds), which is the same as $17 + 27/60 + 22.8/60^{2}$ degrees.
As for Right Ascension, it is measured in terms of hours (base $24$), degrees (base $60$) and decimal. Thus 09 46 52.44 signifies $$ 360 \cdot ( 9/24.0 + 46/(24\cdot 60) + 52.44/(24\cdot 60^{2}) ) \; \hbox{degrees} \, . $$
This somewhat bizarre mixture of conventions is the legacy code of ancient astronomy. The heritage is mongrel --- we owe it to several civilizations: the Babylonians (who used base 60 for all technical computations); the Egyptians (who divided the day into hours); the Greeks, mainly through the work of the Hellenistic astronomer Claudius Ptolemy (a resident of Alexandria whose work remained the foundations of astronomy in Europe and Islam for roughly 1500 years); and the Arabs (who invented decimal fractions about 900 C.E.). Keep in mind that for an observer on Earth, there is a certain equivalence between time and angles, since the Earth rotates $360^{\circ}$ in 24 hours.
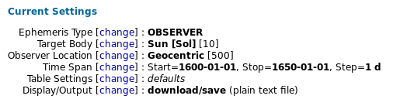
A problem arises. According to the rules I set out originally, we are not allowed to access Mars data when Mars is obscured by the Sun. In order to take this into account, we shall need also data of the Sun's apparent location. NASA can also give this to us:
Coordinates
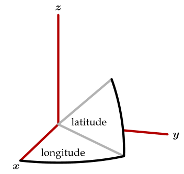
For our purposes there are two coordinate systems of interest to an astronomical observer on earth. And in any coordinate system there are two kinds of coordinates, rectangular and polar. (1) The equatorial system. The origin is the center of the earth (which moves). The positive $z$-axis passes through the North Pole, the $(x, y)$ plane passes through the equator, and the positive $x$-axis is parallel to the ray towards the Sun from the Earth on the day of the Spring equinox. (2) The ecliptic system. The origin is again the center of the Earth, but the $(x, y)$-plane is that containing the Earth's orbit. The positive $z$-axis is located according to the right-hand rule regarding the Earth's motion in its orbit. The $x$-axis is the same as in the equatorial system. This is legitimate, because the line containing this ray is also the intersection of the equatorial plane with the orbital plane.
There is a problem with many aspects of coordinate systems in astronomy --- with respect to the fixed stars, the direction of the North Pole moves at a steady rate ("precession of equinoxes"). But then the length of a day isn't really constant, either (see an earlier Feature Column, Solar Daze), and the "fixed" stars aren't really fixed. Furthermore, no planet actually moves periodically in a fixed orbit. I'll ignore all these problems, which cause what are for us only secondary effects.
For astronomers on Earth, only directions are apparent. This means that our data is recorded in angles. We shall need to convert between the two coordinate systems we are interested in. There is a general formula for converting between polar coordinates of any two orthogonal coordinate systems, but it is noticeably simple in this particular case since the positive $x$-axes agree. That means that the $y$- and $z$-axes are related by a single plane rotation, whose matrix can be easily found:
The rotation angle is the angle between the equatorial plane and that of the Earth's orbit. It can be estimated from knowing the highest latitude at which the Sun appears directly overhead in the summer. This occurs on the Tropic of Cancer at latitude $\varepsilon \sim 23.5^\circ$. Therefore $$ M = \left [ \matrix { 1 & 0 & 0 \cr 0 & \cos(\varepsilon) & -\sin(\varepsilon) \cr 0 & \sin(\varepsilon) & \phantom{-}\cos(\varepsilon) \cr } \right ] \cdot \hbox { ecliptic } = \hbox{ equatorial } \, . $$
This leads to a procedure transforming back and forth between equatorial and ecliptic angular coordinates. This problem can be broken up into simpler steps. The basic formulas allow going back and forth between rectangular coordinates $(x, y, z)$ and 3D polar coordinates $(R, \hbox{longitude}, \hbox{latitude})$ in any orthogonal coordinate system: $$ \eqalign { x &= R \cos(\hbox{latitude})\cos(\hbox{longitude}) \cr y &= R \cos(\hbox{latitude})\sin(\hbox{longitude}) \cr z &= R \sin(\hbox{latitude}) \cr } \qquad \hbox{(polar-to-xyz)} $$
and $$ \eqalign { \sin(\hbox{latitude}) &= z/R \cr \cos(\hbox{longitude}) &= x/r \cr \sin(\hbox{longitude}) &= y/r \cr } \qquad \hbox{(xyz-to-polar)} $$
with $r = \sqrt{x^2 + y^2}$.
So to transform angles-to-angles, transform first to rectangular coordinates, then transform the rectangular coordinates using the matrix $M$, then change back to angles.
The final formula was known to ancient astronomers in a different form (above all, because it was medieval Hindu astronomers who introduced the $\sin$ function). It can be derived directly by using the geometry of spherical triangles (i e. spherical trigonometry).
Using the data
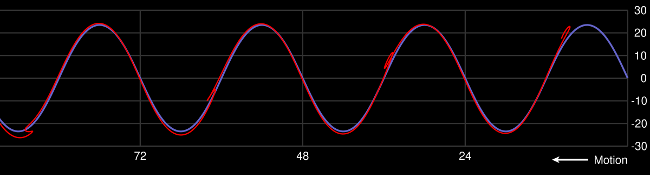
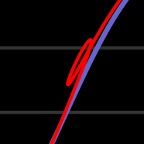
From just a small part of the data supplied by NASA, I plotted the trajectory of Mars in the sky starting on January 1, 1600, and going on for a few years:
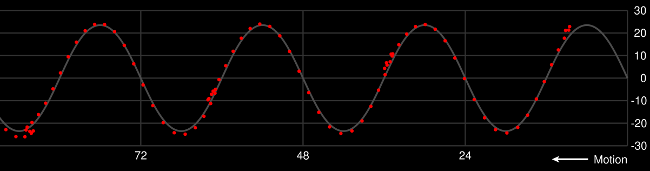
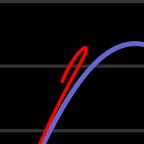
This shows the trajectory itself well enough, but gives no sense of time. In the following figure, I planted disks every 30 days:
Both plots record Right Ascension horizontally, Declination vertically. The trajectory starts at the right, on January 1, 1600, and moves to the left, because that is how an observer in the northern hemisphere would perceive the passage of Mars among the fixed stars. Of course the Right Ascension, strictly peaking, lies between $0$ and $24$, but a periodic path on a cylinder can always be unwound.
The pale path approximating the orbit of Mars shows the intersection of the celestial sphere with the plane of the Earth's orbit. I plotted it by computing the equatorial coordinates of a circular path in that plane, according to the procedure I sketched above. We can see that Mars sometimes lies above this ecliptic path, and sometimes below.
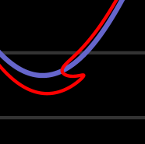
The most noticeable features of both plots are the little loops in the trajectory.
We can see from the second plot that these loops mark points in the orbit where the planet seems to be stationary and even moves backwards. Motion in this part of the orbit is called retrograde.
At any rate, it is the data contained in these figures, as well as similar data that is not plotted, that will be used to simulate Kepler's travail.
Position and opposition
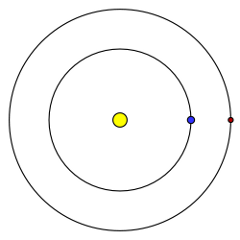
In astronomy before telescopes were used, measurements were adequately accurate only in certain configurations. For the Sun, there were moments of sunrise and culmination (when the sun reached its highest point at noon). For the planets, these were oppositions --- when the Sun, Earth, and Mars are aligned in longitude --- in other words, if seen from above things would appear like this:
Measurements at oppositions are the basic data of ancient astronomy. Moments when the Earth and Mars are in opposition are geometrically convenient, since that happens when Mars appears on the zenith meridian at midnight. That is to say, when the difference between the right ascensions of Mars and the Sun is close to 12 hours. In the fifty years we are looking at, these take place roughly at
January 31, 1600
March 05, 1602
April 10, 1604
May 26, 1606
August 06, 1608
October 21, 1610
December 09, 1612
January 17, 1615
February 20, 1617
March 27, 1619
May 06, 1621
July 06, 1623
September 25, 1625
November 22, 1627
January 03, 1630
February 08, 1632
March 13, 1634
April 19, 1636
June 09, 1638
August 25, 1640
November 02, 1642
December 19, 1644
January 25, 1647
February 28, 1649
(Since we are reading only once a day, we expect to be slightly inaccurate.) The interval between any two seems to be a little over two years. But more precisely, the first several intervals are $$ 764, \> 767, \> 776, \> 803, \> 806, \> 780, \> 769, \> 765, \> 765, \> 771, \> 791, \> 812, \> \dots $$
You can begin to see from these data what difficulties Kepler was facing.
What possible rule can explain these apparently random data?
To be continued ...
- NASA HORIZONS home page
As you can see, NASA offers three options for retrieving data --- telnet/ftp, email, or interactive web access. The last is already extraordinarily convenient, especially because of the `save to file' option.
- The NASA page on which you can retrieve your own data is the HORIZONS data request page.
- R. A. R. Tricker, Paths of the planets, 1956.
R. A. R. Tricker is one of my favourite authors. He has specialized in explaining many somewhat technical parts of science in reasonably elementary ways without shying away from mathematics. I have referred to his work on meteorological optics in earlier columns on rainbows. He has also written on clouds, water waves, and electromagnetism.
- Retrograde motion in Wikipedia.
Wikipedia has lots of relevant entries. This is a useful one.
- Sky map
There are lost of nice pictures on the 'Net related to astronomy and coordinate systems. This is a good one.
Bill Casselman
University of British Columbia, Vancouver, Canada
Email Bill Casselman